The Research Group is Moving!
During winter term 2021/22, we move to University of Bamberg. From Oct. 15, 2021, Fabian Beck holds a full professor position on Information Visualization.
New webpage of the research group: https://www.uni-bamberg.de/vis
Team
Academic Staff
Shivam Agarwal
- Room:
- S-GW 311
- Phone:
- +49 201 18-34654
- Email:
- shivam.agarwal (at) paluno.uni-due.de
- Address:
- Institut für Informatik und Wirtschaftsinformatik (ICB)
Universität Duisburg-Essen
Gerlingstraße 16
45127 Essen, Germany - Author Profile:
- Google Scholar
- ResearchGate
Bio:
Shivam Agarwal is a doctoral candidate at University of Duisburg-Essen. He completed his Masters degree in Information Technology from International Institure of Information Technology, Bangalore. Additionally, he has experience in academia, working as Research Associate on visualization projects and in software development.
For a full list of publications, check out the Google Scholar profile.
Honours and Awards:
[2020] Won the first prize to support the Flatland community in NeurIPS 2020 competition through visual analysis of intelligent train schedules. Read the news here.
[2020] Won Best Paper Award at Vision, Modeling, and Visualization (VMV) 2020 conference for the paper titled "Visualizing Sets and Changes in Membership Using Layered Set Intersection Graphs". Read the news here.
[2019] Received an award to provide visualization support for Artificial Intelligence development. Read the news here.
Fields of Research:
Shivam Agarwal's research interests primarily include two domains of computer science: visualization and artificial intelligence. He is motivated to build and discover research solutions that have applications in diverse areas.
Sets and graphs are two general concepts that have vast and diverse applications. Taking on the challenge of temporal analysis, one of Shivam Agarwal's research interests includes finding ways to visualize dynamic sets and graphs.
Additionally, Shivam is interested in analyzing how computer players (trained by artificial intelligence) play games. For instance, to discover the strategies the computer players have learned over the training process and how they can be used to help game designers via playtesting, among others.
Shivam is also interested in pedagogy, where he builds research solutions to enhance the learning of students. These projects include building visualizations to show student engagement, collaboration in small teams (project groups), and finding simplistic visual alternatives to complex concepts in artificial intelligence.
Other interests include text analysis, data comics, etc. For a full list of offered project/thesis topics, check out this page.
Keywords: visual analytics, dynamic set/graph visualization, artificial intelligence (AI), game analytics, AI playtesting, and learning analytics
Publications:
- Krause, Cedric; Agarwal, Shivam; Ghoniem, Mohammad; Beck, Fabian: Visual Comparison of Multi-label Classification Results. In: Vision, Modeling, and Visualization. 2021. doi:10.2312/vmv.20211367PDFCitationAbstractDetails
In multi-label classification, we do not only want to analyze individual data items but also the relationships between the assigned labels. Employing different sources and algorithms, the label assignments differ. We need to understand these differences to identify shared and conflicting assignments. We propose a visualization technique that addresses these challenges. In graphs, we present the labels for any classification result as nodes and the pairwise overlaps of labels as links between them. These graphs are juxtaposed for the different results and can be diffed graphically. Clustering techniques are used to further analyze similarities between labels or classification results, respectively. We demonstrate our prototype in two application examples from the machine learning domain.
- Latif, Shahid; Agarwal, Shivam; Gottschalk, Simon; Chrosch, Carina; Feit, Felix; Jahn, Johannes; Braun, Tobias; Tchenko, Yannick Christian; Demidova, Elena; Beck, Fabian: Visually Connecting Historical Figures Through Event Knowledge Graphs. In: IEEE VIS 2021 - Short Papers. IEEE, 2021, p. 156-160. doi:10.1109/VIS49827.2021.9623313PDFCitationAbstractDetails
Knowledge graphs store information about historical figures and their relationships indirectly through shared events. We developed a visualization system, VisKonnect, for analyzing the intertwined lives of historical figures based on the events they participated in. A user’s query is parsed for identifying named entities, and related data is retrieved from an event knowledge graph. While a short textual answer to the query is generated using the GPT-3 language model, various linked visualizations provide context, display additional information related to the query, and allow exploration.
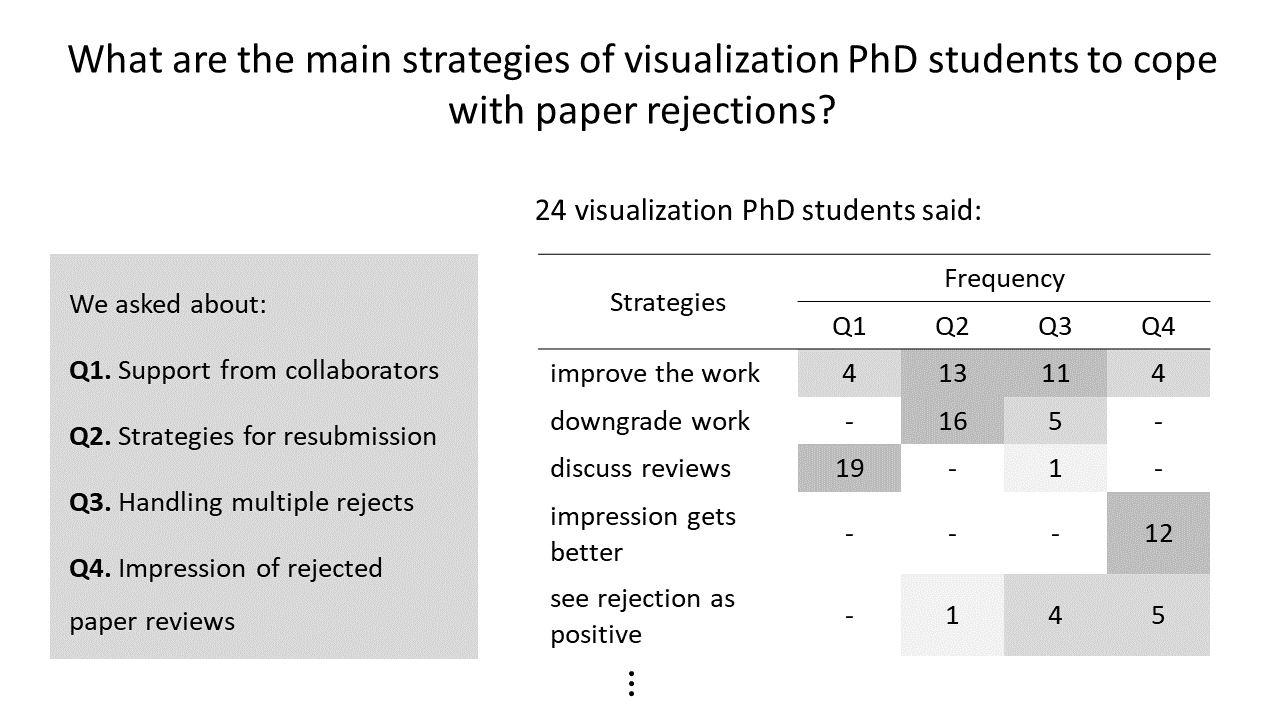
- Agarwal, Shivam; Latif, Shahid; Beck, Fabian: How Visualization PhD Students Cope with Paper Rejections. In: IEEE Workshop Celebrating the Scientific Value of Failure (FailFest). 2020, p. 6-10. doi:10.1109/FailFest51498.2020.00006PDFCitationAbstractDetails
We conducted a questionnaire study aimed towards PhD students in the field of visualization research to understand how they cope with paper rejections. We collected responses from 24 participants and performed a qualitative analysis of the data in relation to the provided support by collaborators, resubmission strategies, handling multiple rejects, and personal impression of the reviews. The results indicate that the PhD students in the visualization community generally cope well with the negative reviews and, with experience, learn how to act accordingly to improve and resubmit their work. Our results reveal the main coping strategies that can be applied for constructively handling rejected visualization papers. The most prominent strategies include: discussing reviews with collaborators and making a resubmission plan, doing a major revision to improve the work, shortening the work, and seeing rejection as a positive learning experience.
- Agarwal, Shivam; Tkachev, Gleb; Wermelinger, Michel; Beck, Fabian: Visualizing Sets and Changes in Membership Using Layered Set Intersection Graphs. In: Proceedings of Vision, Modeling, and Visualization. The Eurographics Association, 2020. doi:10.2312/vmv.20201189PDFCitationAbstractDetails
Challenges in set visualization include representing overlaps among sets, changes in their membership, and details of constituent elements. We present a visualization technique that addresses these challenges. The approach uses set intersection graphs that explicitly visualize each set intersection as a rectangular node and elements as circles inside them. We represent the graph as a layered node-link diagram using colors to indicate the sets. The layers reflect different levels of intersections, from the base sets in the lowest layer to potentially the intersection of all sets in the highest layer. We provide different perspectives to show temporal changes in set membership. Graphs for individual, two, and all timesteps are visualized in static, diff, and aggregated views. Together with linked views and filters, the technique supports the detailed exploration of dynamic set data. We demonstrate the effectiveness of the proposed approach by discussing two application examples. The submitted supplemental material contains a video showing proposed interactions in the implementation and the prototype itself.
- Agarwal, Shivam; Auda, Jonas; Schneegaß, Stefan; Beck, Fabian: A Design and Application Space for Visualizing User Sessions of Virtual and Mixed Reality Environments. In: Proceedings of Vision, Modeling, and Visualization. The Eurographics Association, 2020. doi:10.2312/vmv.20201194PDFCitationAbstractDetails
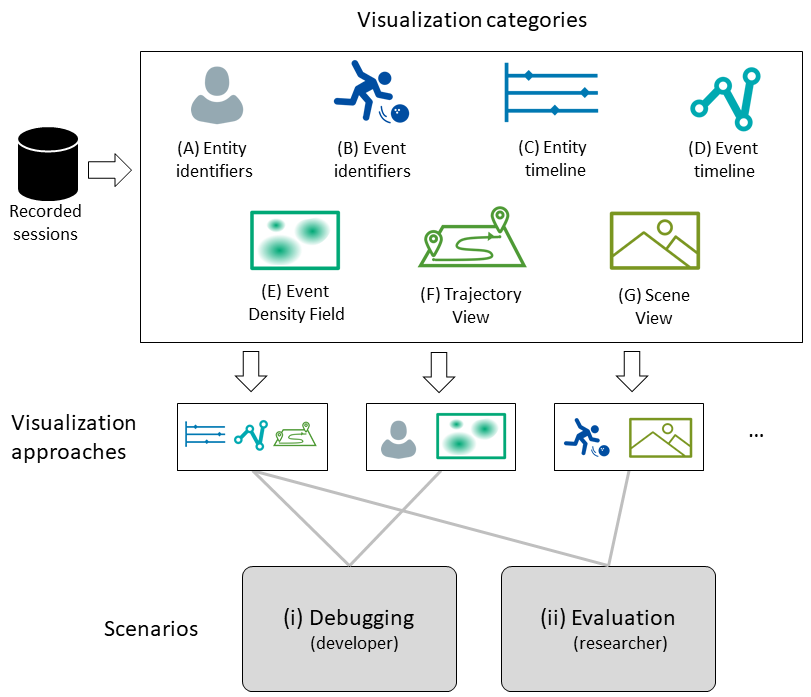
Virtual and mixed reality environments gain complexity due to the inclusion of multiple users and physical objects. A core challenge for developers and researchers while analyzing sessions from such environments lies in understanding the interaction between entities. Additionally, the raw data recorded from such sessions is difficult to analyze due to the simultaneous temporal and spatial changes of multiple entities. However, similar data has already been visualized in other areas of application. We analyze which aspects of these related visualizations can be leveraged for analyzing user sessions in virtual and mixed reality environments and describe a design and application space for such visualizations. First, we examine what information is typically generated in interactive virtual and mixed reality applications and how it can be analyzed through such visualizations. Next, we study visualizations from related research fields and derive seven visualization categories. These categories act as building blocks of the design space, which can be combined into specific visualization systems. We also discuss the application space for these visualizations in debugging and evaluation scenarios. We present two application examples that showcase how one can visualize virtual and mixed reality user sessions and derive useful insights from them.
- Agarwal, Shivam; Herrmann, Christian; Wallner, Günter; Beck, Fabian: Visualizing AI Playtesting Data of 2D Side-scrolling Games. In: Proceedings of IEEE Conference on Games. 2020, p. 572-575. doi:10.1109/CoG47356.2020.9231915PDFCitationAbstractDetails
Human playtesting is a useful step in the game development process, but involves high economic costs and is time-consuming. While playtesting through artificial intelligence is gaining attention, it is challenging to analyze the collected data. We address the challenge by proposing visualizations to derive insights about level design in 2D side-scrolling games. To focus on the navigation behavior in the level design, we study the trajectories of computer agents trained using artificial intelligence. We demonstrate the effectiveness of our approach by implementing a web-based prototype and presenting the insights gained from the visualizations for the game Sonic the Hedgehog 2. We highlight lessons learned and directions to customize the approach for other analysis goals of playtesting.
- Agarwal, Shivam; Beck, Fabian: Set Streams: Visual Exploration of Dynamic Overlapping Sets. In: Computer Graphics Forum, Vol 39 (2020) No 3, p. 383-391. doi:10.1111/cgf.13988PDFCitationAbstractDetails
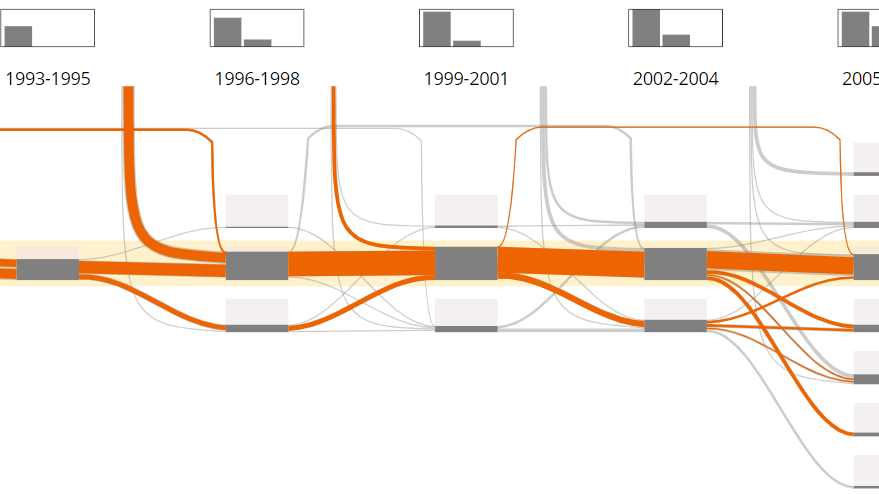
In many applications, membership of set elements changes over time. Since each element can be present in multiple sets, the sets also overlap. As a result, it becomes challenging to visualize the temporal change in set membership of elements across several timesteps while showing individual set intersections. We propose Set Streams, a visualization technique that represents changing set structures on a timeline as branching and merging streams. The streams encode the changing membership of elements with set intersections. A query-based selection mechanism supports a flexible comparison of selected groups of elements across the temporal evolution. The main timeline view is complemented with additional panels to provide details about the elements. While the proposed visualization is an application-independent visualization technique for dynamic sets, we demonstrate its effectiveness and applicability through three diverse application examples and expert feedback.
- Agarwal, Shivam; Wallner, Günter; Beck, Fabian: Bombalytics: Visualization of Competition and Collaboration Strategies of Players in a Bomb Laying Game. In: Computer Graphics Forum, Vol 39 (2020) No 3, p. 89-100. doi:10.1111/cgf.13965PDFCitationAbstractDetails
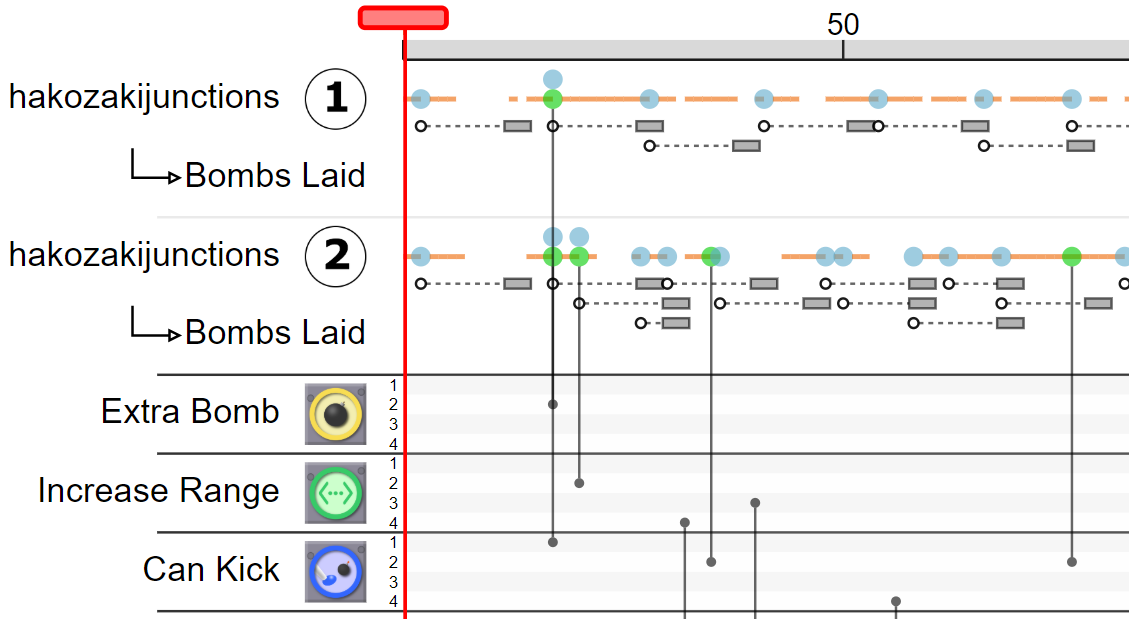
Competition and collaboration form complex interaction patterns between the agents and objects involved. Only by understanding these interaction patterns, we can reveal the strategies the participating parties applied. In this paper, we study such competition and collaboration behavior for a computer game. Serving as a testbed for artificial intelligence, the multiplayer bomb laying game Pommerman provides a rich source of advanced behavior of computer agents. We propose a visualization approach that shows an overview of multiple games, with a detailed timeline-based visualization for exploring the specifics of each game. Since an analyst can only fully understand the data when considering the direct and indirect interactions between agents, we suggest various visual encodings of these interactions. Based on feedback from expert users and an application example, we demonstrate that the approach helps identify central competition strategies and provides insights on collaboration.
A curated literature collection on a specific topic helps researchers to find relevant articles quickly. Assigning multiple keywords to each article is one of the techniques to structure such a collection. But it is challenging to assign all the keywords consistently without any gaps or ambiguities. We propose to support the user with a machine learning technique that suggests keywords for articles in a literature collection browser. We provide visual explanations to make the keyword suggestions transparent. The suggestions are based on previous keyword assignments. The machine learning technique learns on the fly from the interactive assignments of the user. We seamlessly integrate the proposed technique in an existing literature collection browser and investigate various usage scenarios through an early prototype.
Courses:
Project Group: Compat AI (SoSe 2020)


