News
Tue, 21. Sep. 2021 Latif, Shahid
Interactions that Connect Words and Numbers
New research results on bridging the gap between text and diagrams as part of the DFG-funded project vgiReports.
Documents and news articles often contain diagrams next to the text, which give more detailed insights into the data the text relates to. However, their presentation is usually static, despite the opportunities that modern digital devices provide. Instead of just placing the different representations next to each other, interactions can link the two representations more closely. To help bridge the gap between the representations and to make the content more explorative, the research project vgiReports targets investigating interactive documents with such links in the context of volunteered geographic information (VGI). Research at the University of Duisburg-Essen led by PhD candidate Shahid Latif, supervised by Fabian Beck, and in collaboration with external partners has led to new results. They describe options to link text and diagrams, provide tools to create such links with ease, and give examples of how interactive links support data exploration.
Investigating the implicit and explicit links that already exist in data-driven stories published by popular news media, the research revealed a set of best practices. These can help data journalists to design compelling and informative stories around certain data. Currently, we see many such articles published on the Covid-19 pandemic, which were also considered as examples in the conducted research [paper].
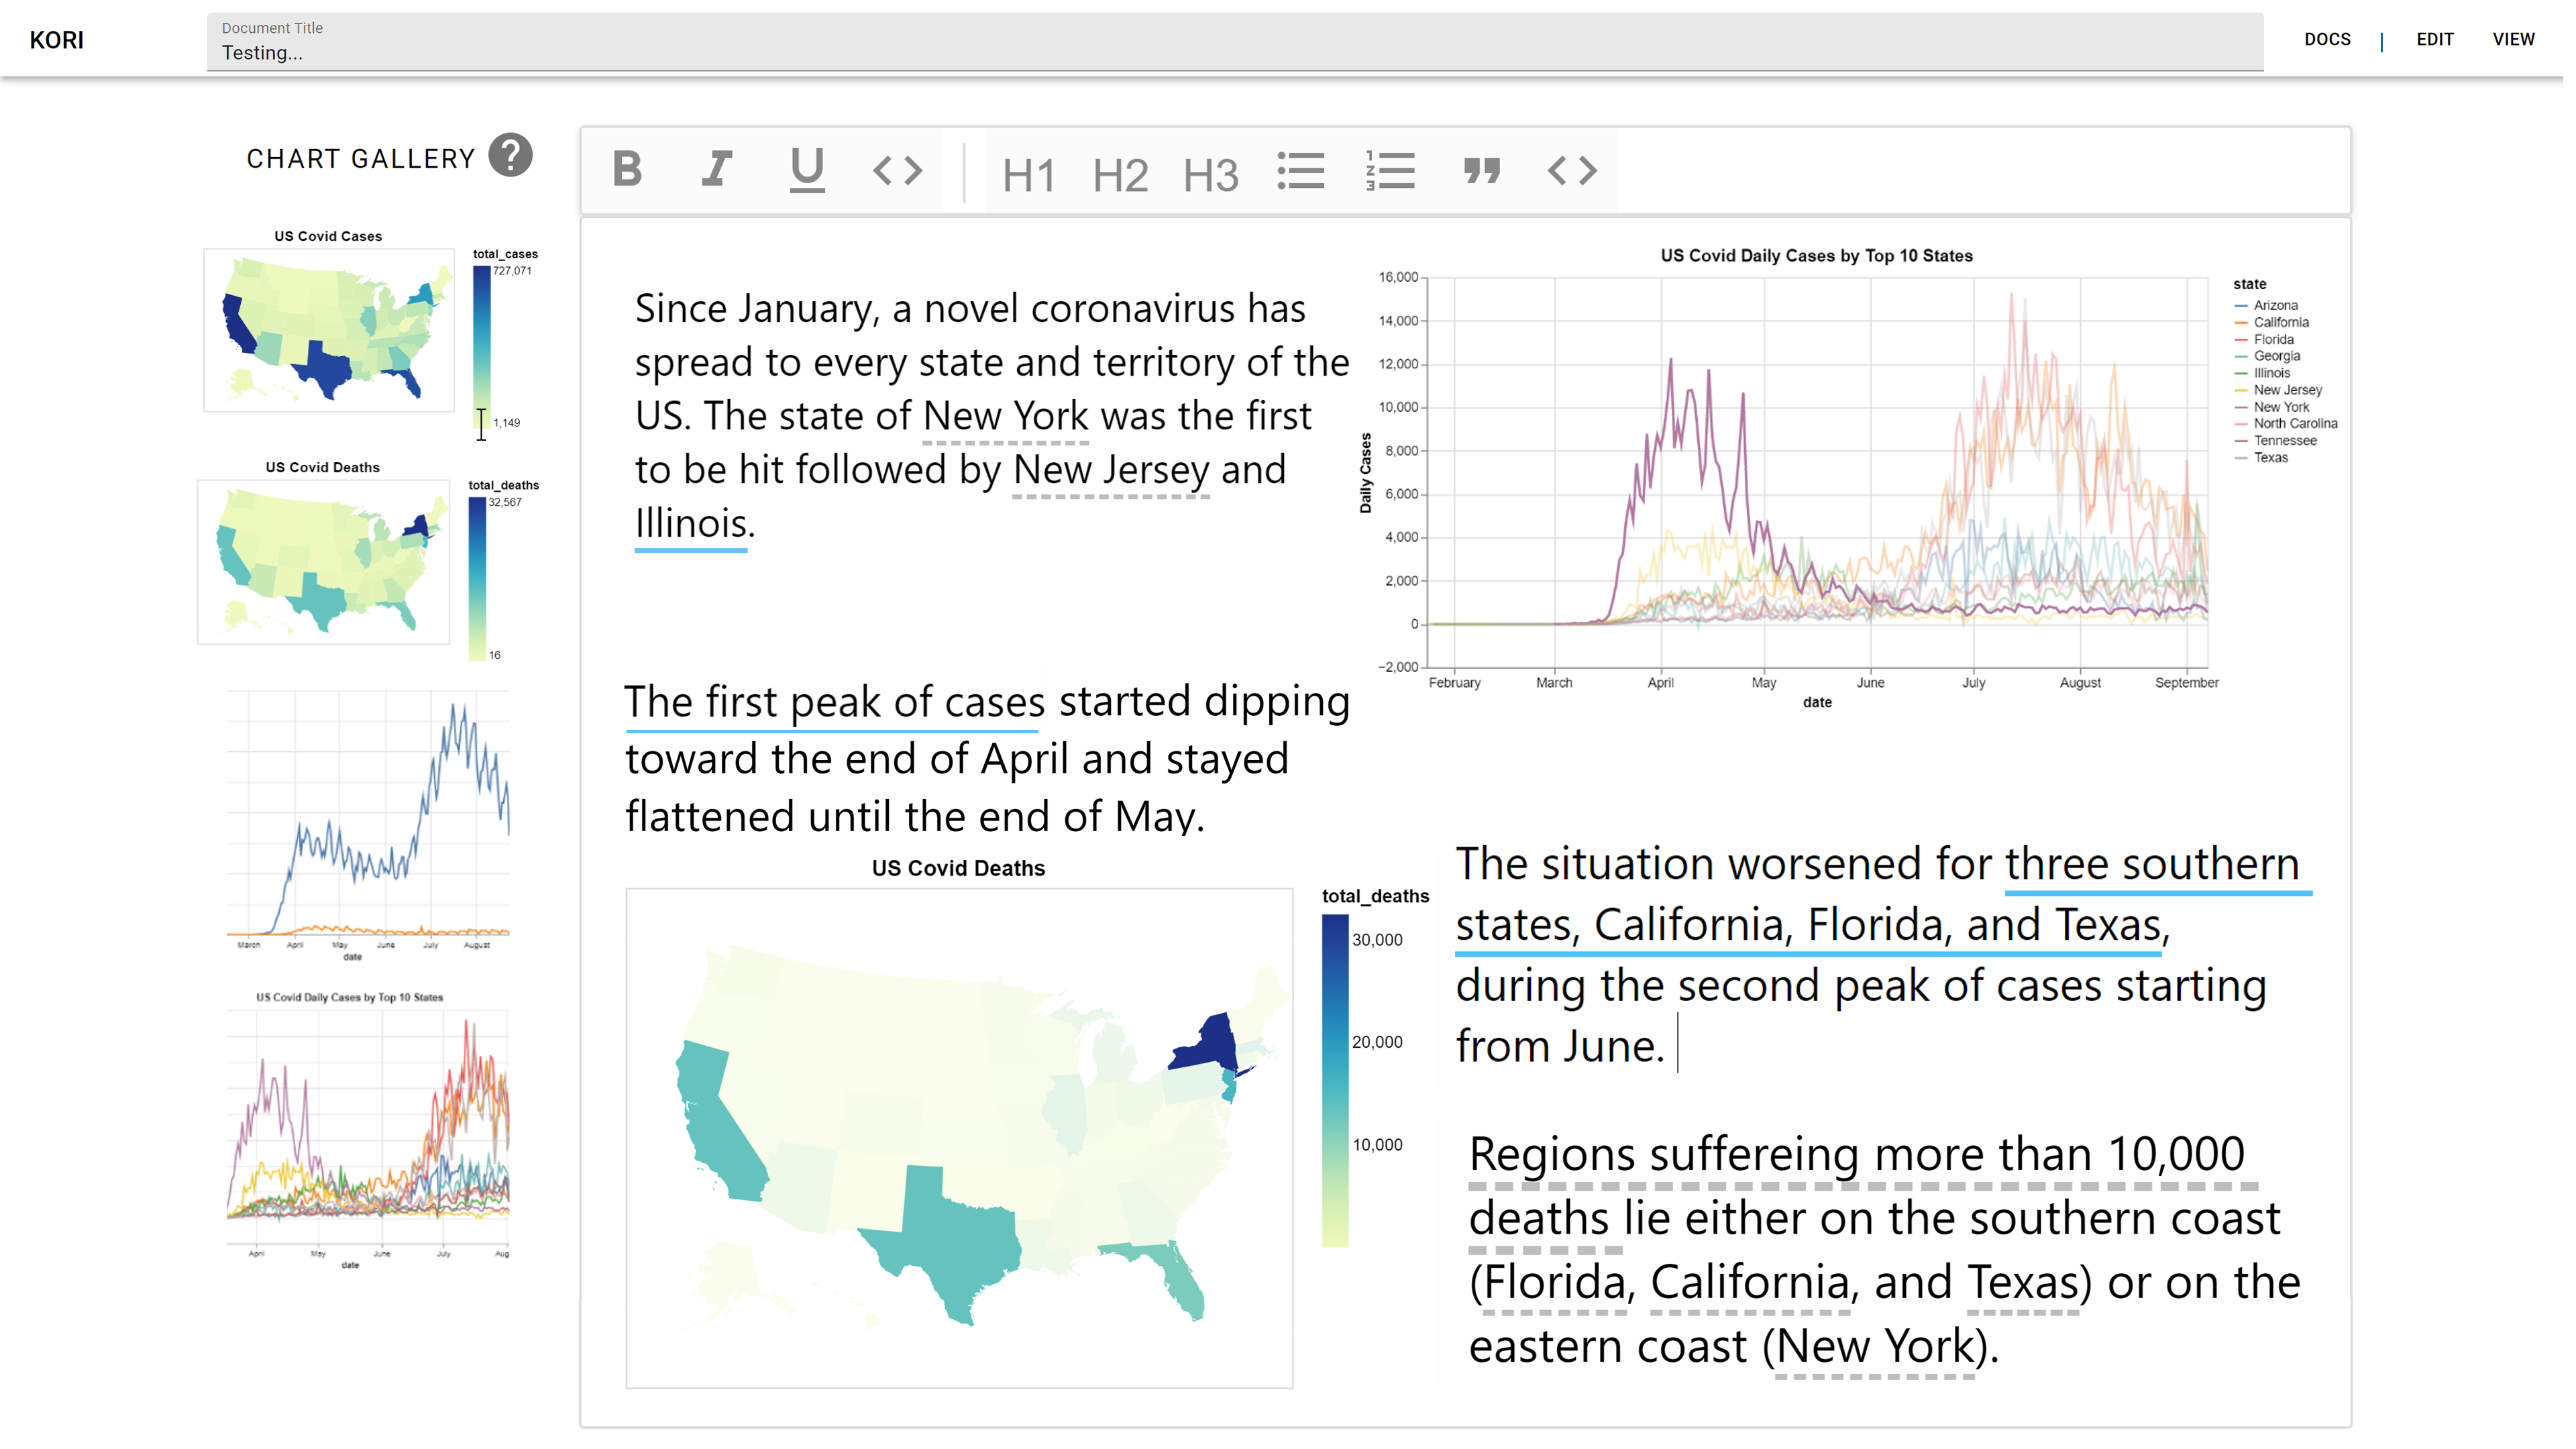
To further allow authors of interactive data-driven stories to easier link the text and diagrams, a web-based tool, Kori, was designed. It employs state-of-the-art natural language processing techniques to automatically detect the phrases that are related to parts of the accompanying diagrams. Besides, it offers an innovative user interface to link a textual phrase to visual marks in the charts [paper].
The research project applies these ideas in various application areas. Recently, a system to investigate the lives of historic figures was suggested where users can ask questions and the system replies using a mix of text and linked charts. While the answer is generated using an AI model (the GPT-3 language model), the system puts the answer in a context by visualizing data on a timeline and other views. This allows users to explore the data beyond just the information that was inquired [paper].
The research has been done in collaboration with national and international partners. It is published in Computer Graphics Forum (CGF) and IEEE Transactions on Visualization and Computer Graphics (TVCG), two of the leading visualization journals, as well as is presented at the EuroVis 2021 and IEEE VIS 2021 conferences. As part of the VGIscience lecture series, Shahid Latif summarized the research also in a single talk [video].