The Research Group is Moving!
During winter term 2021/22, we move to University of Bamberg. From Oct. 15, 2021, Fabian Beck holds a full professor position on Information Visualization.
New webpage of the research group: https://www.uni-bamberg.de/vis
Research Areas
Our group investigates foundational questions in different areas of visualization research and applies them to practical scenarios. The following areas cover our main research interests while our publications and video presentations report the detailed findings and our web-based software solutions provide examples of interactive visualization systems.
Information Visualization
Information visualization discusses fundamental concepts of the visual encoding of abstract data, that is data that does not have a natural spatial representation. Applications are manifold and can be found in all disciplines that process and analyze data.
Hierarchy and Network Visualization
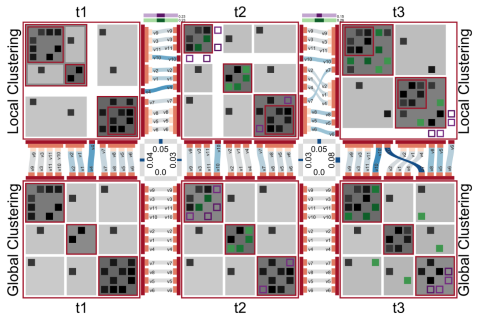
Relations between entities are represented in hierarchies and networks. Visualizations of these structures facilitate the exploration of complex relational information such as can be found in social networks or modular software systems. Our research focuses on the scalable representation of hierarchies and networks, in particular, considering their dynamic changes and differences between variants of the same entities.
Word-Sized Graphics Embedded into Text
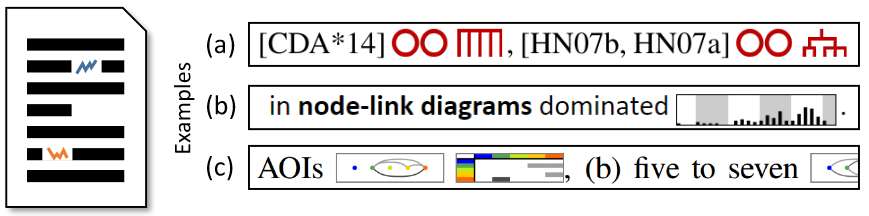
Visualizations at the size of a word allow a close integration of text and data. We investigate different scenarios to enrich natural language texts and source code. For example, we use of such embeddings to communicate bibliographic data or report findings of eye tracking studies. A particular challenge and opportunity is to establish an interactive interplay between text and word-sized visualizations.
Software Visualization
In software engineering, developers need to optimize and extend complex software systems - information visualization methods provide an exploration tool to read and understand the structure, evolution, and behavior of such systems.
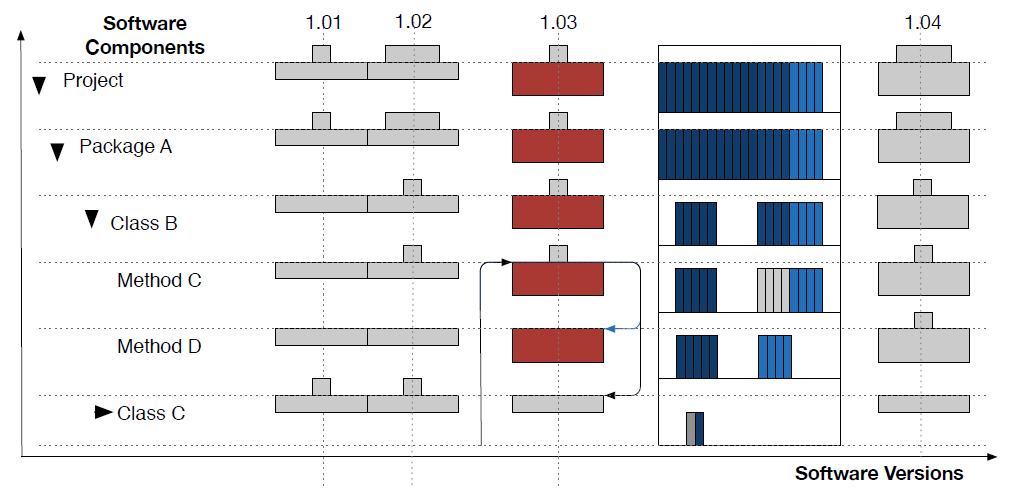
Software Maintenance and Evolution
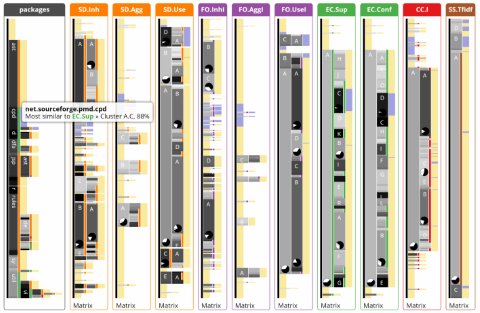
Software is constantly changing to adapt to new requirements and implement improvements. Our visualizations provide support in this maintenance process and help analyze the course of software evolution. For instance, we visualize the modularization (i.e., the hierarchical organization) of a software system and suggest alternative, improved modularizations, which facilitate easier maintenance in the future.
Software Behavior and Performance
For fixing bugs or optimizing the performance of a system, software developers require detailed information about the behavior of the software. Since a program running for a few seconds already executes millions of instructions and triggers thousands of state changes, analyzing such data is complex, but visualization can provide support. For instance, we study how source code changes interact with software behavior to find causes of runtime issues and prevent them.
Visual Analytics
Bringing together data analysis algorithms and visualizations, visual analytics systems facilitate and interactive exploration of large and complex data sets.
Self-explanatory Documents
Mixing visualizations with text in interactive documents promises to produce self-explanatory, expressive data representations. We investigate how automatic methods to generate text from data can enrich the visual representations and how the two representations can best be interactively linked for a close integration.
Spatiotemporal Data
Movement creates data in space and time, with specific events attached. We provide visual analysis solutions for such data, focusing on the integration of various data streams and abstracting the low-level data to high-level, interpretable patterns. Specific examples we study are the analysis of eye movement data and the behavior of virtual agents and human users.